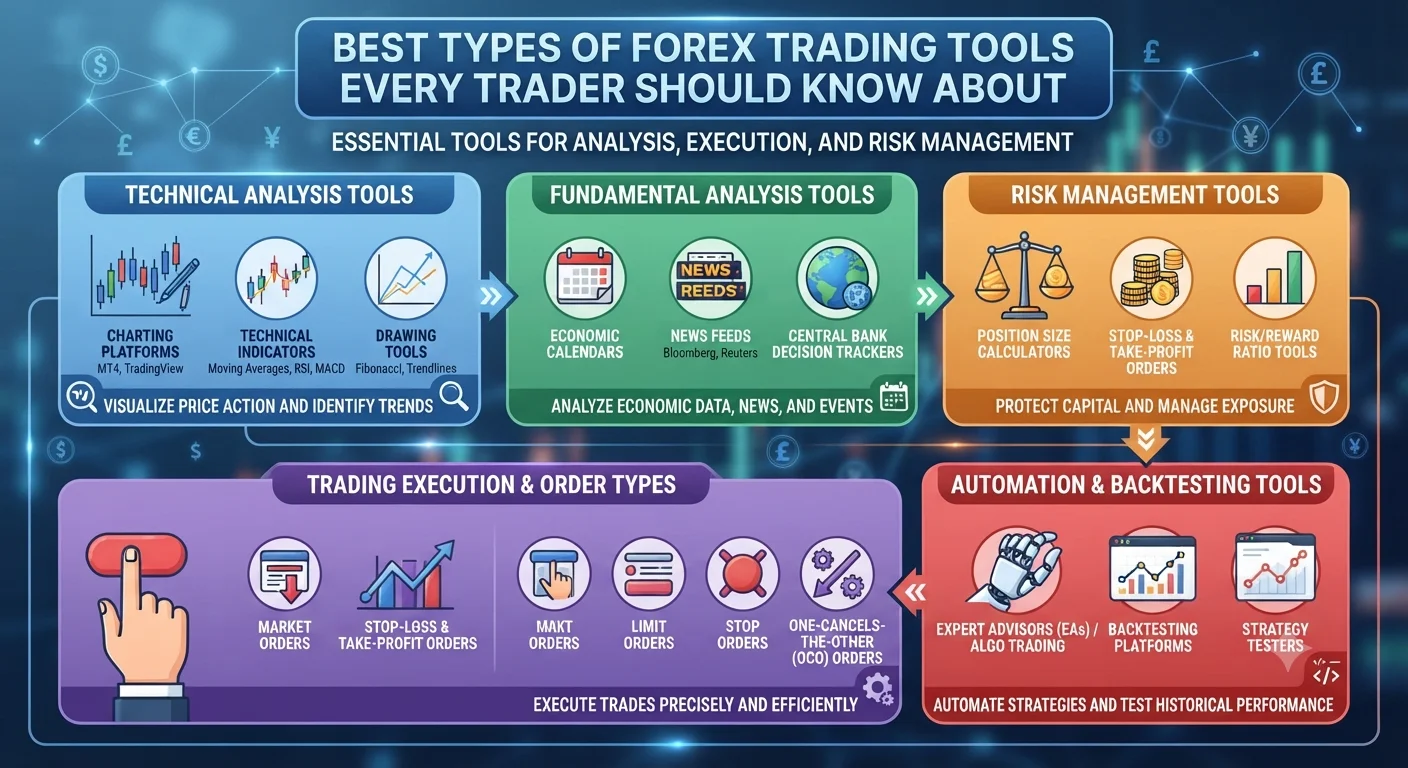
Forex trading tools are software applications, calculators and data services that help traders analyse the market, manage their risk, execute their strategy and track their performance. Using the right tools does not guarantee profits but trading without them puts you at a significant disadvantage compared to traders who do use them.
Why Forex Trading Tools Matter
Trading currencies without tools is like navigating a city without a map. You might eventually get where you are going but you will waste time take wrong turns and miss opportunities that a well-equipped trader would not.
The right tools serve three core purposes:
Analysis: helping you understand where the market is and where it might go next
Risk management: helping you calculate position sizes and ensure each trade carries the correct level of risk for your account
Performance tracking: helping you review your past trades so you can identify what is working and what needs to change
Most of the tools discussed in this guide are available free of charge or at very low cost. There is no need to spend significant money on tools as a beginner. Getting familiar with the free versions first makes sense before committing to paid subscriptions.
The Full Breakdown: Essential Forex Trading Tools
- Why Forex Trading Tools Matter
- The Full Breakdown: Essential Forex Trading Tools
- 1. Economic Calendar
- 2. Pip Value Calculator
- 3. Position Size Calculator
- 4. Forex Heat Map
- 5. Forex Correlation Calculator
- 6. Charting Software
- 7. Trading Journal
- 8. Forex VPS (for Automated Traders)
- 9. Forex Signal Services (Use with Caution)
- Mistakes and Red Flags to Avoid
- Frequently Asked Questions
- Q: What is the most important forex trading tool for beginners?
- Q: Is MetaTrader 4 or TradingView better?
- Q: Are forex signal services worth using?
- Q: What is a forex heat map?
- Q: Do I need to pay for trading tools?
1. Economic Calendar
An economic calendar is a schedule of upcoming economic data releases and central bank events that are known to move currency prices. It is arguably the most important tool for any forex trader to have open during market hours.
Key events tracked on an economic calendar include:
| Event Type | Examples | Impact Level |
|---|---|---|
| Central bank decisions | Fed rate decision, ECB rate announcement | Very High |
| Employment data | Non-Farm Payrolls, unemployment rate | Very High |
| Inflation data | CPI, PPI, PCE | High |
| Growth data | GDP releases | High |
| Trade data | Trade balance reports | Medium |
| Consumer data | Retail sales, consumer confidence | Medium |
Each event is colour-coded by its expected market impact. A red or high-impact event means the release has historically caused significant price volatility and traders should be aware of it before holding open positions.
Where to find one: Forex Factory and Investing.com both offer free, comprehensive economic calendars updated in real time.
2. Pip Value Calculator
A pip value calculator tells you exactly how much money you gain or lose for each pip the price moves on a given currency pair at a specific position size. This is a fundamental calculation for risk management.
Why it matters: The pip value of EUR/USD differs from the pip value of USD/JPY at the same lot size because of how each pair is quoted. Without calculating pip value accurately you cannot correctly size your position to match your intended risk per trade.
How to use it:
- Enter the currency pair you are trading
- Enter your position size in lots
- Enter your account currency
- The calculator tells you the value of one pip in your account currency
Example: On EUR/USD a standard lot (100,000 units) has a pip value of approximately $10. On USD/JPY the pip value differs. A pip calculator handles this automatically.
Most brokers include a pip value calculator in their platform. Free versions are also available on Babypips and MyFXBook.
3. Position Size Calculator
A position size calculator takes your account balance, your chosen risk percentage per trade and your stop-loss distance in pips and calculates exactly how many lots you should trade.
This is the practical tool that makes the 1% rule work in real time. Instead of doing the calculation manually on every trade you enter the three values and the calculator gives you the correct position size immediately.
Inputs required:
- Account balance
- Risk percentage (typically 1% to 2%)
- Currency pair
- Stop-loss distance in pips
Output: The exact number of lots to trade so that a stop-loss hit produces the predetermined loss and no more.
4. Forex Heat Map
A forex heat map is a visual display showing the relative strength or weakness of multiple currencies against each other simultaneously. It uses colour coding (typically green for strength and red for weakness) to make it immediately obvious which currencies are moving and in which direction.
How traders use it:
- To quickly identify the strongest and weakest currencies of the day
- To find currency pair trading opportunities by matching a strong currency against a weak one
- To avoid trading against the dominant intraday momentum
A heat map helps traders avoid the mistake of buying a weak currency pair when a strong directional trend is already established across the market.
5. Forex Correlation Calculator
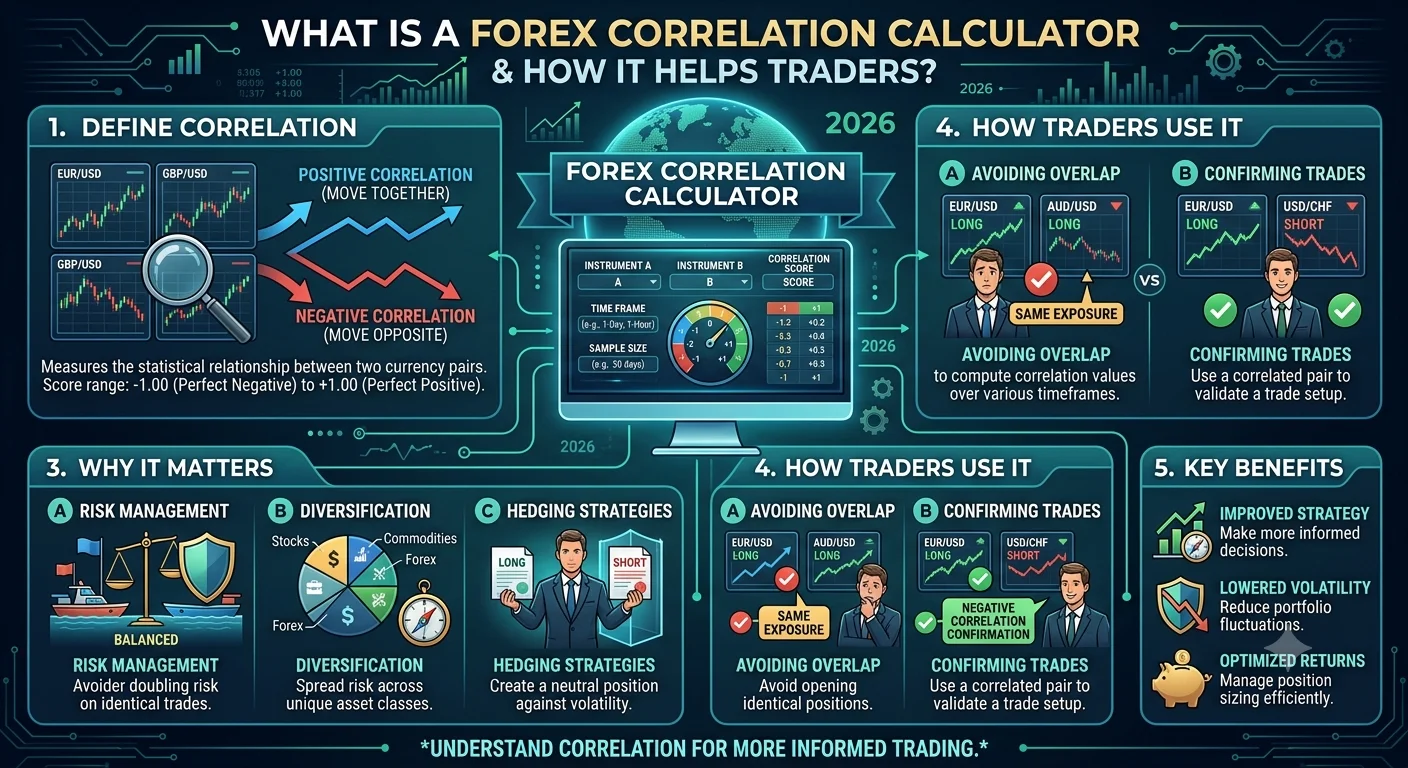
Currency pairs do not move independently of each other. Many pairs are strongly correlated meaning they tend to move in the same direction at the same time.
Example: EUR/USD and GBP/USD have a historically high positive correlation. When the US Dollar strengthens both pairs typically fall at the same time. If you hold buy positions on both pairs simultaneously you are effectively doubling your USD risk.
A correlation calculator shows you the correlation coefficient between any two currency pairs over a selected time period. A coefficient close to +1 means the pairs move almost identically. A coefficient close to -1 means they move in almost exactly opposite directions.
Why it matters for risk management: If you hold three highly correlated pairs simultaneously your risk exposure is far higher than the individual position sizes suggest.
Recommended Articles
 TRADING TOOLS, INDICATORS SOFTWARE
6. Charting Software
Charting software is the platform you use to view price charts, apply technical indicators and identify trade setups. This is the primary tool for any technically-oriented trader.
What to look for in charting software:
| Feature | Why It Matters |
|---|---|
| Multiple time frame views | Allows top-down analysis from daily to 5-minute charts |
| Wide indicator library | Gives access to RSI, MACD, moving averages and others |
| Drawing tools | Allows trend lines, support/resistance levels and Fibonacci levels |
| Alert system | Notifies you when price reaches key levels |
| Historical data depth | More history means better backtesting and pattern analysis |
MetaTrader 4 and MetaTrader 5 are the most widely used charting platforms in retail forex. TradingView is increasingly popular for its clean interface, extensive community and browser-based access.
7. Trading Journal
A trading journal is a record of every trade you place including the entry price, exit price, position size, stop-loss, take-profit, the reason you entered and the outcome. It is one of the most underused yet most valuable tools in any trader's toolkit.
What a trading journal reveals over time:
- Which currency pairs you perform best on
- Which trading sessions produce your best results
- Whether you follow your own rules consistently
- What your actual win rate and risk-to-reward ratio are versus what you think they are
- Patterns in your losing trades that you would not otherwise notice
Without a trading journal you are trading blind. You have no reliable data about your own performance and no way to identify whether changes you make are actually improving your results.
A trading journal can be as simple as a spreadsheet with the fields above. Dedicated apps such as Edgewonk or MyFXBook's autojournalling feature are available for those who prefer purpose-built tools.
8. Forex VPS (for Automated Traders)
For traders using Expert Advisors (EAs) or other automated strategies a Forex VPS (Virtual Private Server) is an essential tool. It is a rented server that keeps your trading platform running continuously 24 hours a day even when your personal computer is switched off.
Without a VPS an automated strategy can miss trades during power cuts, internet outages or when your computer is simply not on. A VPS eliminates these gaps and typically provides lower latency connections to your broker's servers which means faster order execution.
9. Forex Signal Services (Use with Caution)
A forex signal service sends you buy and sell recommendations based on analysis by a trader or automated system. Signals typically include the entry price, stop-loss and take-profit levels for a specific currency pair.
The caution here is genuine: The majority of forex signal services either have no verified live track record, produce results only under ideal conditions or are designed primarily to generate subscription revenue rather than trading profits.
If you use a signal service never follow it blindly without understanding the reasoning behind the trades. Track results independently from the first day and be extremely skeptical of any service that shows only winning trades in its marketing.
Mistakes and Red Flags to Avoid
Using too many indicators: Adding more indicators to a chart does not improve analysis. It creates conflicting signals and confusion. Most experienced traders use two or three indicators maximum alongside price action.
Ignoring the economic calendar: Holding trades through high-impact news events without awareness of the schedule is one of the most common and avoidable mistakes a retail trader makes.
Skipping the trading journal: Without recording your trades you have no reliable data about your actual performance. You may believe you are trading well based on memory when the data would tell a very different story.
Paying for tools before mastering free ones: Most of the tools above are available free. Paying for premium versions before you have consistently used the free versions is money wasted.
Frequently Asked Questions
Q: What is the most important forex trading tool for beginners?
The economic calendar and position size calculator are the two most immediately useful tools for beginners. The economic calendar prevents you from being caught off guard by market-moving events. The position size calculator ensures you never risk more than your intended amount on any trade.
Q: Is MetaTrader 4 or TradingView better?
They serve different primary purposes. MetaTrader 4 is a complete trading platform that allows you to place trades directly with your broker and run automated Expert Advisors. TradingView is primarily a charting and analysis platform with an exceptional interface and large community. Many traders use TradingView for analysis and MetaTrader 4 for execution.
Q: Are forex signal services worth using?
Most retail forex signal services do not have independently verified live track records and should be treated with significant skepticism. A beginner following signals without understanding why the trade was taken learns nothing and has no basis for evaluating whether the service is genuinely profitable over time. Developing your own strategy skills is a far more valuable use of time and money.
Q: What is a forex heat map?
A forex heat map is a colour-coded visual display showing the relative strength or weakness of multiple currencies simultaneously. It helps traders identify which currencies are trending strongly on a given day and find trade opportunities by matching strong currencies against weak ones.
Q: Do I need to pay for trading tools?
No. The most important forex trading tools including economic calendars, pip calculators, position size calculators, heat maps and basic charting are available free of charge. MetaTrader 4 is free. TradingView has a comprehensive free tier. Paying for tools only makes sense once you have mastered the free versions and have a specific need that a paid tool addresses.