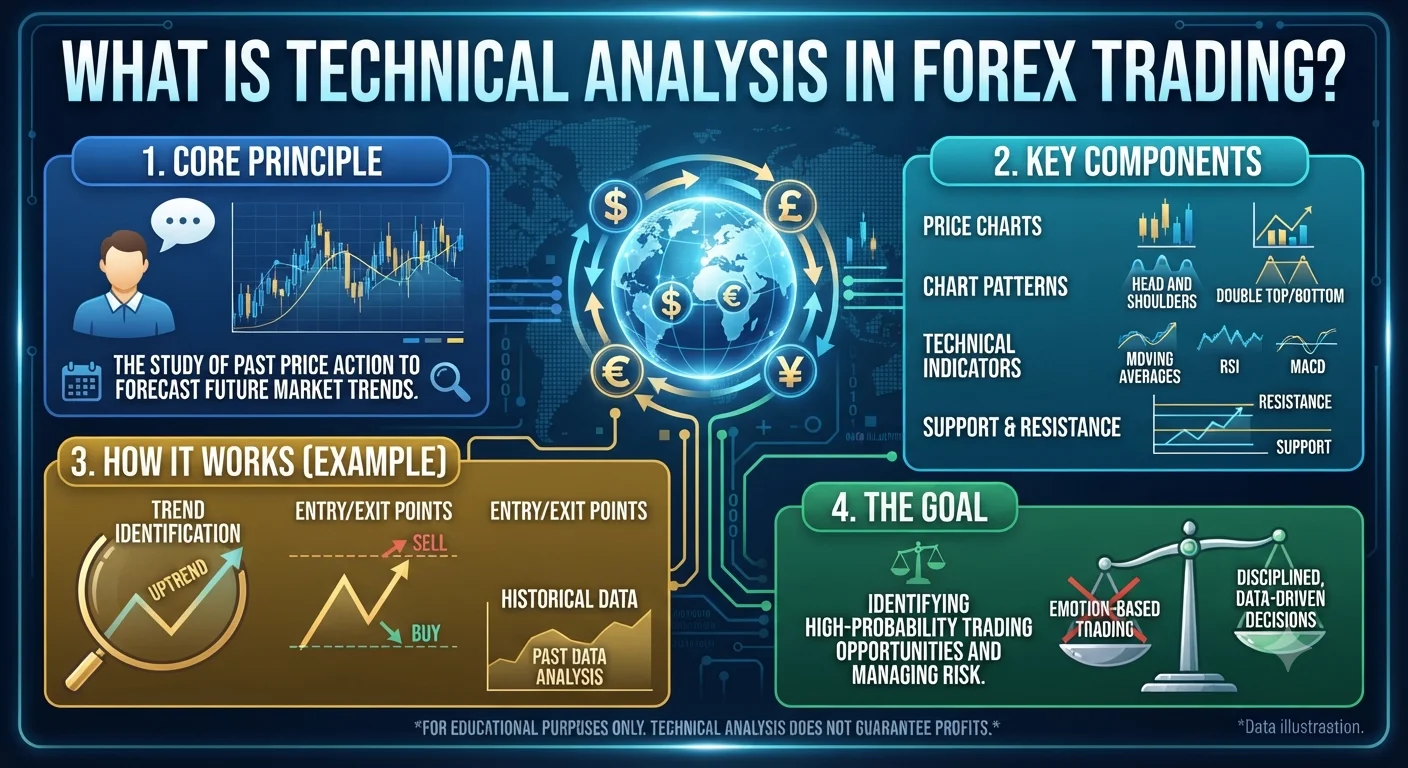
Technical analysis is the study of past price movements on a chart to forecast the likely direction of future prices. Forex traders who use technical analysis believe that all relevant market information — economic data, news events, trader psychology — is already reflected in the current price, and that price patterns tend to repeat over time.
Quick Definition: What Is Technical Analysis?
There are two main approaches to analysing the forex market:
Fundamental analysis asks: why should this currency be worth more or less? It studies economic data, central bank interest rate decisions, inflation figures, and geopolitical events to assess the underlying value of a currency.
Technical analysis asks: what is the price doing right now, and where is it likely to go next? It ignores the underlying reasons and focuses entirely on the price chart itself.
Technical analysts — often called chartists — believe that:
- The market discounts everything. Whatever economic conditions exist, their effect on trader behaviour is already visible in the price.
- Price moves in trends. Once a trend is established, it is more likely to continue than to reverse.
- History repeats itself. Patterns in price charts recur because human psychology — fear, greed, hope — is consistent over time.
These three principles form the foundation of technical analysis, as originally articulated by Charles Dow in the early 20th century and developed further by practitioners including Ralph Nelson Elliott and Richard Wyckoff.
How Technical Analysis Works in Real Forex Trading
- Quick Definition: What Is Technical Analysis?
- How Technical Analysis Works in Real Forex Trading
- Step 1 — Determine the Trend
- Step 2 — Identify Key Price Levels
- Step 3 — Apply Indicators for Confirmation
- Step 4 — Look for Candlestick Pattern Confirmation
- A Practical Example
- Why Technical Analysis Matters for Your Trading Results
- The Limitation: Fundamental Events Override Technicals
- Frequently Asked Questions
- Q: Is technical analysis reliable in forex trading?
- Q: What is the best technical indicator for beginners?
- Q: What is the difference between technical analysis and fundamental analysis?
- Q: Can technical analysis be used for automated trading?
- Q: What are the most reliable candlestick patterns?
A technical trader typically follows a structured process when analysing a currency pair before placing a trade.
Step 1 — Determine the Trend
Before placing any trade, the trader looks at a higher time frame (typically the daily or 4-hour chart) to determine the overall trend direction:
- Uptrend: a sequence of higher highs and higher lows
- Downtrend: a sequence of lower highs and lower lows
- Ranging: price moving sideways between two roughly horizontal levels
Trading in the direction of the dominant trend significantly improves the probability of success for most technical strategies.
Step 2 — Identify Key Price Levels
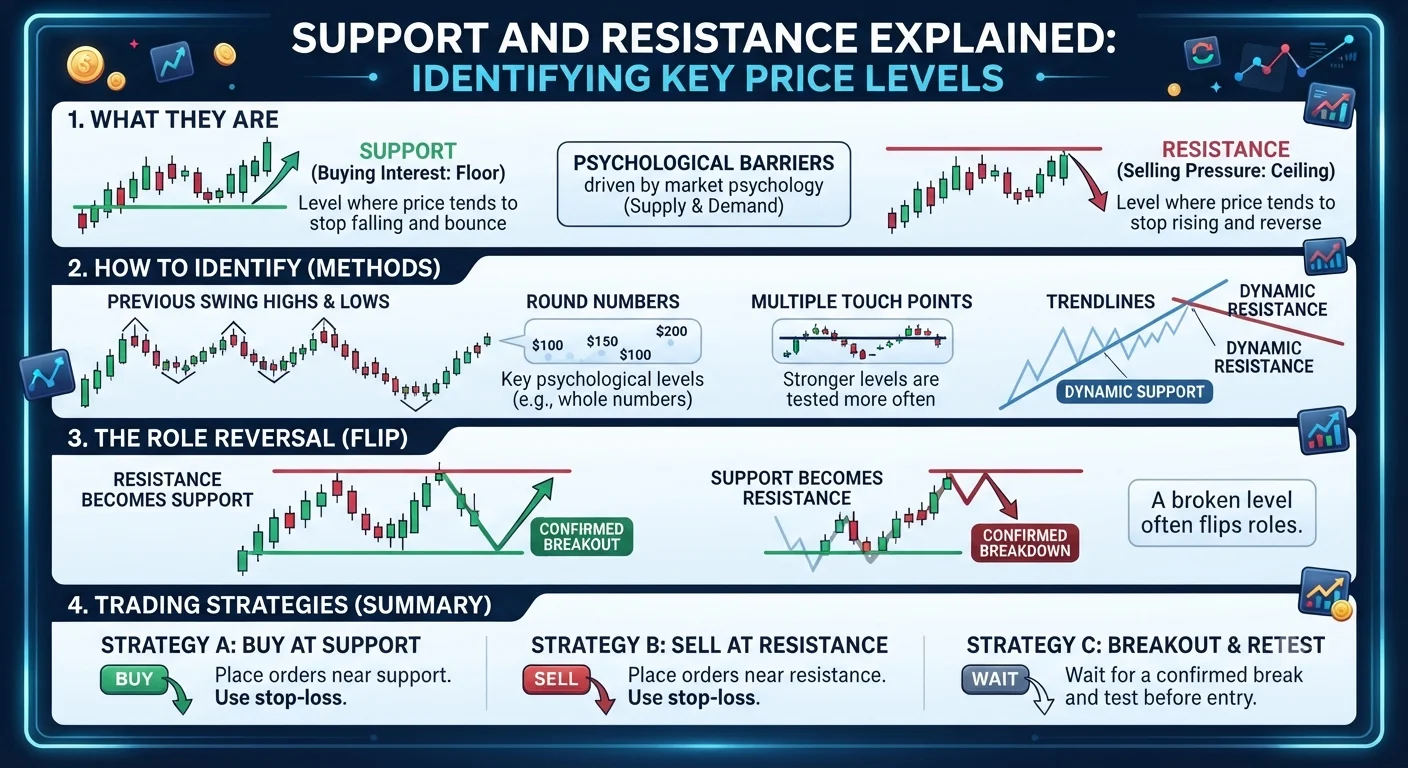
Support and resistance are the two most fundamental concepts in technical analysis:
- Support is a price level where buying pressure has historically been strong enough to stop the price falling further. Think of it as a floor.
- Resistance is a price level where selling pressure has historically been strong enough to stop the price rising further. Think of it as a ceiling.
These levels form because traders remember previous turning points. When the price returns to a level where it reversed before, many traders expect it to reverse again — and their collective action often causes exactly that.
Step 3 — Apply Indicators for Confirmation
Technical indicators are mathematical calculations applied to price data that help traders confirm what the chart is already suggesting. They are derived from historical price and volume data, meaning they are always slightly lagging — they confirm what has already happened rather than predicting what will happen.
The most widely used indicators in forex technical analysis:
| Indicator | What It Measures | Common Use |
|---|---|---|
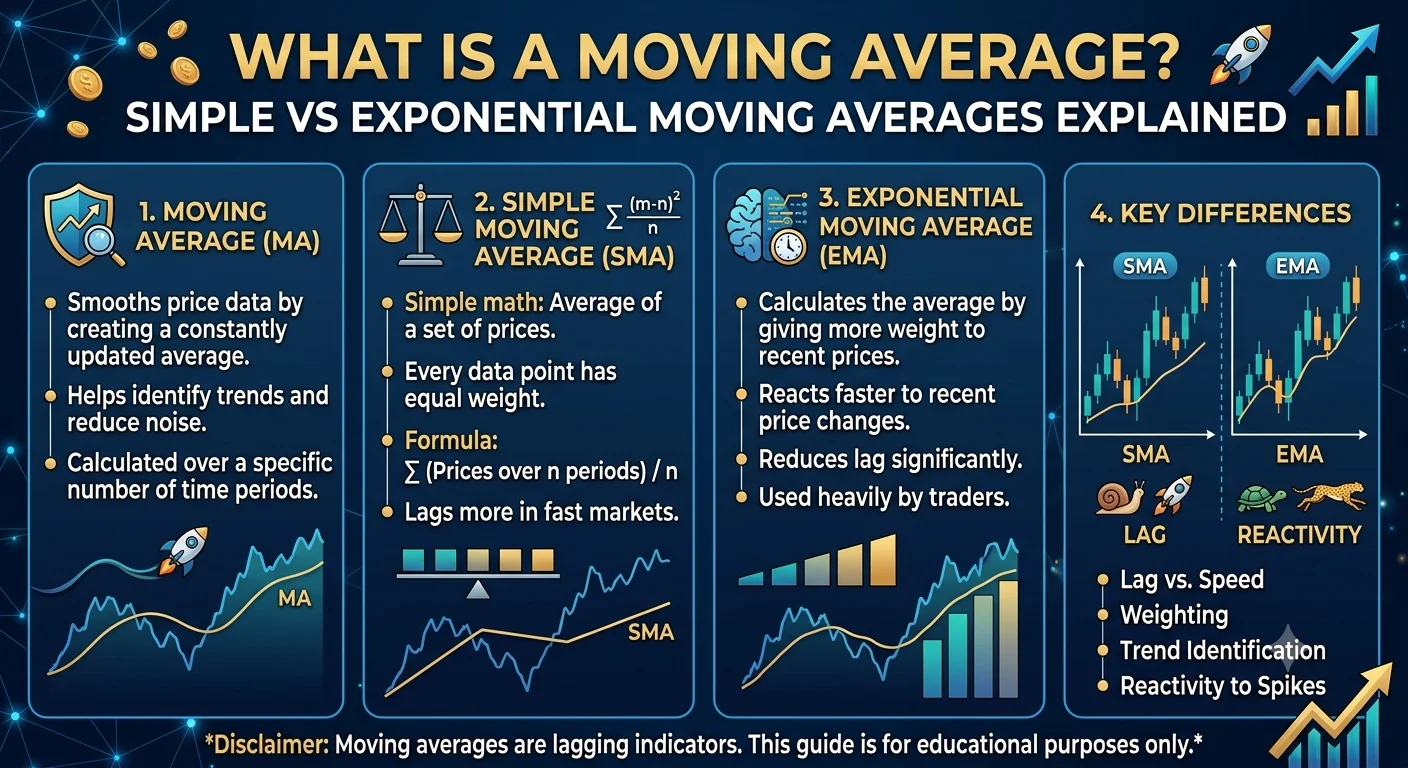
| Moving Average (SMA/EMA) | Average price over N periods | Identify trend direction and dynamic support/resistance |
| RSI (Relative Strength Index) | Speed and magnitude of price change (0–100 scale) | Identify overbought (above 70) and oversold (below 30) conditions |
| MACD | Relationship between two exponential moving averages | Spot momentum shifts and crossover signals |
| Bollinger Bands | Price volatility around a central moving average | Identify squeeze conditions and potential breakouts |
| Fibonacci Retracement | Key percentage retracement levels (38.2%, 50%, 61.8%) | Find pullback entry zones within an established trend |
| Stochastic Oscillator | Current price relative to its range over N periods | Confirm overbought/oversold conditions, similar to RSI |
💡 Important Note: Indicators should be used to confirm what the chart structure is already suggesting — not as standalone buy or sell signals. Two or three indicators pointing in the same direction at a key support or resistance level is far more meaningful than a single indicator in isolation.
Step 4 — Look for Candlestick Pattern Confirmation
Candlestick patterns are visual formations on the price chart that can signal potential reversals or continuations. Common patterns include:
Recommended Articles
 TRADING STRATEGIES TECHNICAL ANALYSIS
 TRADING STRATEGIES TECHNICAL ANALYSIS
- Doji: a candle where open and close are nearly equal — signals indecision
- Hammer / Inverted Hammer: small body with long lower wick at a support level — signals potential bullish reversal
- Engulfing patterns: a large candle that fully engulfs the previous candle — signals momentum shift
- Shooting Star: small body with long upper wick at a resistance level — signals potential bearish reversal
A Practical Example
A trader is analysing GBP/USD on the 4-hour chart. Here is what they observe:
- The daily chart shows a clear uptrend in place for three weeks.
- The price has pulled back to a known support level at 1.2650 — a zone where buyers stepped in strongly on two previous occasions.
- The RSI reads 36, suggesting the pair is approaching oversold territory.
- The 50-period EMA sits at 1.2645, adding confluence to the support zone.
- A bullish hammer candlestick has just formed on the 4-hour chart at 1.2652.
All five signals point in the same direction. The trader decides to enter a long (buy) trade.
Trade Setup:
| Element | Level | Notes |
|---|---|---|
| Entry | 1.2655 | Just above the hammer candle close |
| Stop-loss | 1.2605 | Below the support zone (50 pips of risk) |
| Take-profit | 1.2760 | Next resistance level (105 pips of reward) |
| Risk:Reward | 1:2.1 | Acceptable minimum for most strategies |
This is not a guaranteed profit — it is a structured, evidence-based trade decision where the potential reward justifies the defined risk.
Why Technical Analysis Matters for Your Trading Results
Technical analysis gives traders a consistent, rule-based framework for making decisions. Without a framework, trading becomes guessing, and guessing in a leveraged market is an expensive habit.
Key reasons it matters in practice:
- Removes emotional entry and exit decisions. You act when the chart signals confirm your criteria — not when you feel anxious or excited.
- Provides defined risk. Identifying support and resistance levels tells you exactly where to place a stop-loss before the trade opens.
- Works on all time frames. The same technical principles apply whether you are scalping on a 1-minute chart or position trading on a weekly chart.
- Creates a common language. Millions of traders worldwide watch the same major support/resistance levels and indicators. This collective attention can make these levels partially self-fulfilling.
- Combines with automated trading. Technical rules translate directly into programmable code, making technical analysis the foundation of most Expert Advisors (EAs).
The Limitation: Fundamental Events Override Technicals
Technical analysis has one consistent weakness — it cannot anticipate surprise fundamental events. A perfectly structured technical trade can be wiped out in seconds by an unexpected central bank announcement, a geopolitical shock, or a major economic data release that defies market expectations.
Most experienced forex traders maintain awareness of the economic calendar and avoid holding technical trades through high-impact news events.
Frequently Asked Questions
Q: Is technical analysis reliable in forex trading?
Technical analysis is a widely used and studied discipline. It is not infallible — no method predicts price with certainty. Its value lies in providing a consistent, rule-based framework for identifying high-probability setups and managing risk with defined stop-loss levels. Most professional retail traders use it as their primary decision-making framework.
Q: What is the best technical indicator for beginners?
There is no single "best" indicator. For beginners, the most practical starting point is: the moving average (to identify trend direction), support and resistance levels (to identify entry zones and stop-loss placement), and the RSI (to avoid entering trades when a currency is already extremely overbought or oversold).
Q: What is the difference between technical analysis and fundamental analysis?
Technical analysis studies price charts and historical patterns to forecast where prices are likely to go. Fundamental analysis studies economic data, interest rate policy, and macroeconomic conditions to assess whether a currency is over- or undervalued. Many professional traders use both — fundamentals to determine longer-term directional bias, technicals to time entries and exits.
Q: Can technical analysis be used for automated trading?
Yes — and this is one of its greatest strengths. Technical analysis rules translate naturally into programmable conditions. Most Expert Advisors (EAs) are built entirely on technical analysis — for example, buying when a fast EMA crosses above a slow EMA, or selling when the RSI exceeds 70 near a resistance level.
Q: What are the most reliable candlestick patterns?
Research suggests that candlestick patterns are more reliable as confirmation signals near established support/resistance levels than as standalone signals in the middle of a chart. The most widely cited and tested patterns include the bullish/bearish engulfing, hammer, shooting star, and morning/evening star formations.