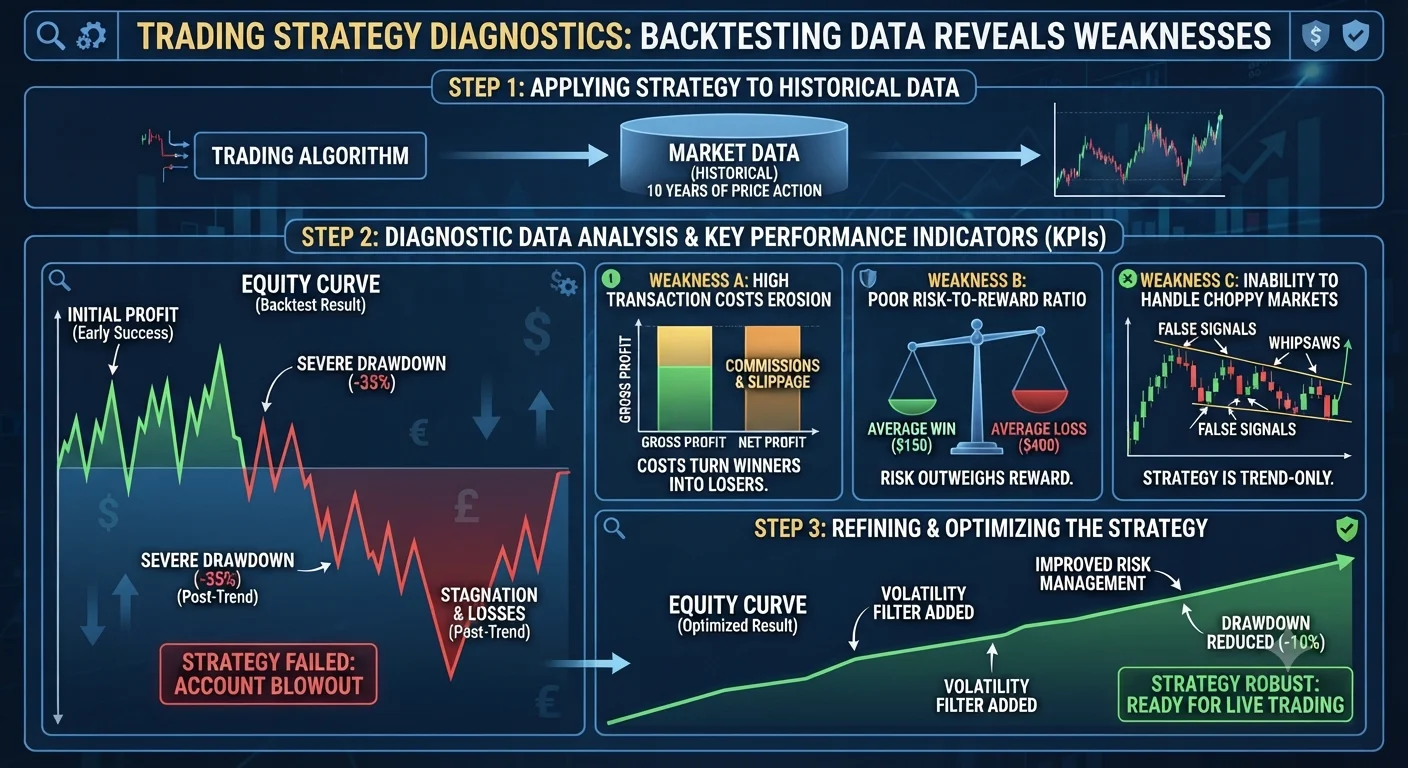
Backtesting is the process of running a trading strategy against historical price data to see how it would have performed in the past. Done correctly it is one of the most powerful tools available to a forex trader because it forces a strategy to face the reality of past market conditions rather than the ideal conditions a trader imagines in their head. The weaknesses that backtesting reveals are exactly the weaknesses that would have cost you money in live trading.
What Is Backtesting and Why It Matters
Every forex trading strategy sounds plausible in theory. The idea of buying when a moving average crosses upward or selling when the RSI enters overbought territory makes logical sense when you explain it. But logic and live market performance are two very different things.
Backtesting is how you close that gap.
By running your strategy rules against months or years of actual historical price data you get a picture of how the strategy behaved across a wide range of market conditions including trending periods, ranging periods, high-volatility events and quiet consolidation phases.
The results that come back from a backtesting run contain far more information than just a profit or loss figure. The individual metrics within the results are where the real weaknesses hide.
Step-by-Step: How to Walk Through Backtesting Data
- What Is Backtesting and Why It Matters
- Step-by-Step: How to Walk Through Backtesting Data
- Step 1: Run the Backtest with Realistic Settings
- Step 2: Read the Equity Curve
- Step 3: Analyse the Maximum Drawdown
- Step 4: Check the Win Rate and Risk-to-Reward Ratio Together
- Step 5: Look at the Distribution of Trades Over Time
- Step 6: Apply the Sharpe Ratio
- Step 7: Test for Over-Optimisation
- Tools and Tips for Getting Backtesting Right
- Common Mistakes to Avoid
- Frequently Asked Questions
- Q: What is backtesting in forex trading?
- Q: Is backtesting accurate?
- Q: What is the Sharpe ratio in forex backtesting?
- Q: What is over-optimisation or curve fitting?
- Q: How long should a backtesting period be?
Step 1: Run the Backtest with Realistic Settings
Before you can read backtesting data meaningfully the backtest itself must be set up correctly. A backtest run with unrealistic settings produces results that look good but mean nothing.
Critical settings to get right:
| Setting | Common Mistake | Correct Approach |
|---|---|---|
| Spread | Set to zero or minimum | Use the actual average spread charged by your broker |
| Commission | Ignored | Include the per-lot commission if your broker charges one |
| Slippage | Ignored | Add 1 to 3 pips of slippage for realistic execution simulation |
| Data quality | Using low-quality tick data | Use high-quality historical data with accurate tick simulation |
| Testing period | 6 months or less | Test across at least 3 to 5 years including different market regimes |
MetaTrader 4 and MetaTrader 5 both include a built-in Strategy Tester for backtesting Expert Advisors. Third-party platforms such as Forex Tester offer more advanced historical simulation tools.
Step 2: Read the Equity Curve
The equity curve is a line chart showing how the account balance grew or fell over the backtesting period. It is the first thing to examine after a backtest runs.
What a strong equity curve looks like:
- A generally upward slope with manageable pullbacks
- No catastrophic drawdown periods from which the strategy never recovered
- Consistent performance across different sections of the testing period
Weaknesses the equity curve reveals:
Flat or declining sections: If the strategy performs well for one year and then flatlines or loses for the next two years it suggests the strategy only works in specific market conditions and has no genuine edge across different regimes.
Sudden large drops: A single large drawdown that dwarfs all previous drawdowns suggests the strategy has no mechanism to protect against extreme market events. One unexpected event could devastate a live account.
Smooth upward curve: Paradoxically an equity curve that rises in an almost perfectly straight line with no meaningful pullbacks is a warning sign of over-optimisation. Real strategies have losing periods. A result that looks too clean usually is.
Step 3: Analyse the Maximum Drawdown
Maximum drawdown is the largest peak-to-trough decline in account value during the entire backtesting period expressed as a percentage.
This metric is one of the most practically important numbers in any backtesting report because it tells you the worst losing run the strategy has historically produced. Before trading any strategy live you need to ask: can I psychologically and financially tolerate this drawdown occurring on my live account?
Example:
A strategy shows a maximum drawdown of 28% over a five-year backtest. On a $10,000 live account that means the strategy has historically produced a period where the account fell to $7,200 before recovering. Could you continue following the strategy's rules through that experience without abandoning it? If not the position size needs to be reduced until the drawdown in dollar terms is tolerable.
Key point: Maximum drawdown in a backtest is typically the minimum you should expect in live trading. Live trading conditions including wider spreads, slippage and psychological pressure tend to produce larger drawdowns than the backtest suggested.
Step 4: Check the Win Rate and Risk-to-Reward Ratio Together
Looking at win rate in isolation is meaningless. A strategy with a 30% win rate can be highly profitable if the average winner is three times larger than the average loser. A strategy with a 70% win rate can lose money if the average loss is five times larger than the average win.
The key metrics to read together:
| Metric | What It Shows |
|---|---|
| Win rate | Percentage of trades that closed in profit |
| Average win | The average profit in pips or currency on winning trades |
| Average loss | The average loss in pips or currency on losing trades |
| Profit factor | Total gross profit divided by total gross loss |
Profit factor is particularly useful. A profit factor above 1.5 indicates a strategy that earns meaningfully more than it loses across the full test period. A profit factor below 1.0 means the strategy lost money overall.
Weakness revealed: If the win rate is high but the profit factor is below 1.5 it means occasional large losses are overwhelming the many small wins. This is a sign of poor stop-loss placement or a strategy that lets losses run too far.
Recommended Articles
 BACKTESTING TRADING INSIGHTS
Step 5: Look at the Distribution of Trades Over Time
Examine how trades are distributed across the testing period. A strategy that places 500 trades in year one and 50 trades in year two has not produced consistent results regardless of what the overall profit figure shows.
What to look for:
- Does the strategy produce a similar number of trades each month?
- Are profits concentrated in just a few very large winning trades or spread consistently across many trades?
- Does the strategy perform differently in different years suggesting sensitivity to market conditions?
A strategy where 80% of the total backtest profit comes from 5% of the trades is fragile. In live trading those few exceptional trades may not appear or may be missed due to execution timing.
Step 6: Apply the Sharpe Ratio
The Sharpe ratio measures the risk-adjusted return of a strategy. It compares the return of the strategy against the volatility of those returns.
A higher Sharpe ratio means the strategy produces consistent returns relative to the risk taken. A low Sharpe ratio means the returns are erratic and the risk taken does not justify the outcome.
| Sharpe Ratio | Interpretation |
|---|---|
| Below 0.5 | Poor risk-adjusted performance |
| 0.5 to 1.0 | Acceptable |
| 1.0 to 2.0 | Good |
| Above 2.0 | Excellent (rare in forex) |
A strategy can show a positive total return in a backtest but have a poor Sharpe ratio if that return was achieved through a single lucky run of trades rather than consistent performance. The Sharpe ratio exposes this.
Step 7: Test for Over-Optimisation
Over-optimisation (also called curve fitting) is one of the most dangerous weaknesses a backtesting analysis can reveal. It occurs when a strategy's parameters have been adjusted so precisely to fit historical data that the strategy performs brilliantly in the backtest but fails immediately when exposed to new market conditions.
Signs of over-optimisation:
- The strategy uses an unusually large number of specific parameter values
- Small changes to any parameter produce dramatically different results
- The strategy performed well only on the exact data set it was tested on
The fix: Divide your historical data into two separate periods. Use the first period (the in-sample period) to develop and optimise the strategy. Then test the finalised strategy on the second period (the out-of-sample period) without making any further adjustments. If the strategy performs reasonably well on data it has never seen before it has a genuine edge. If it fails on the out-of-sample period it was over-optimised.
Tools and Tips for Getting Backtesting Right
Use the highest quality tick data available: MetaTrader's default data often has gaps and inaccuracies. Tools such as Dukascopy or TickStory provide higher quality historical tick data for more accurate simulations.
Test across multiple currency pairs: A strategy that works on EUR/USD but fails on every other pair it was tested on is probably curve-fitted to the specific characteristics of EUR/USD data.
Include all market conditions: Make sure your testing period includes at least one strong trending period, at least one extended ranging period and at least one high-volatility event period. A strategy that only performs well in trending conditions is not a complete strategy.
Document everything: Record the exact parameters tested, the results produced and your conclusions from each backtesting run. Without documentation you cannot accurately compare iterations of the same strategy.
Common Mistakes to Avoid
Testing on too short a period: Six months of backtesting data is not enough to draw reliable conclusions. A strategy may get lucky over a short period through chance alone. Use three to five years minimum.
Ignoring spread and commission: A strategy that shows profit with a zero spread setting may be unprofitable once real costs are included. Always use realistic spread and commission values.
Stopping after one good result: Run the strategy on multiple currency pairs and multiple time periods. One good backtesting result proves very little by itself.
Treating backtest profit as guaranteed future profit: Backtesting tells you how a strategy performed in the past under the conditions that existed then. Markets change. Past performance in a backtest is useful evidence but it is not a guarantee of any kind.
Frequently Asked Questions
Q: What is backtesting in forex trading?
Backtesting is the process of applying a trading strategy's rules to historical price data to simulate how the strategy would have performed in the past. It is used to evaluate a strategy's viability before risking real money and to identify weaknesses that need to be addressed.
Q: Is backtesting accurate?
Backtesting provides useful evidence about a strategy's historical performance but it has inherent limitations. It cannot fully replicate the unpredictability of live markets, the psychological pressure of real money trading or the impact of future market condition changes that did not exist in the historical data tested. A good backtest reduces uncertainty but does not eliminate it.
Q: What is the Sharpe ratio in forex backtesting?
The Sharpe ratio is a measure of risk-adjusted return. It compares the return produced by a strategy against the volatility of those returns. A Sharpe ratio above 1.0 indicates the strategy produces meaningful returns relative to the risk it takes. It is used alongside profit factor and maximum drawdown to evaluate backtesting results holistically.
Q: What is over-optimisation or curve fitting?
Over-optimisation occurs when a trading strategy's parameters are adjusted so precisely to match historical data that the strategy performs well only on the data it was tested on and fails on any new data. It is one of the most common reasons backtested strategies fail in live trading and is detected by testing the finalised strategy on a separate out-of-sample data set.
Q: How long should a backtesting period be?
A minimum of three years of historical data is recommended for most forex strategies. Five years is better because it is more likely to include different market regimes including trending markets, ranging markets and high-volatility periods. Strategies tested on only six to twelve months of data may produce results that reflect one specific market condition rather than a genuine strategic edge.