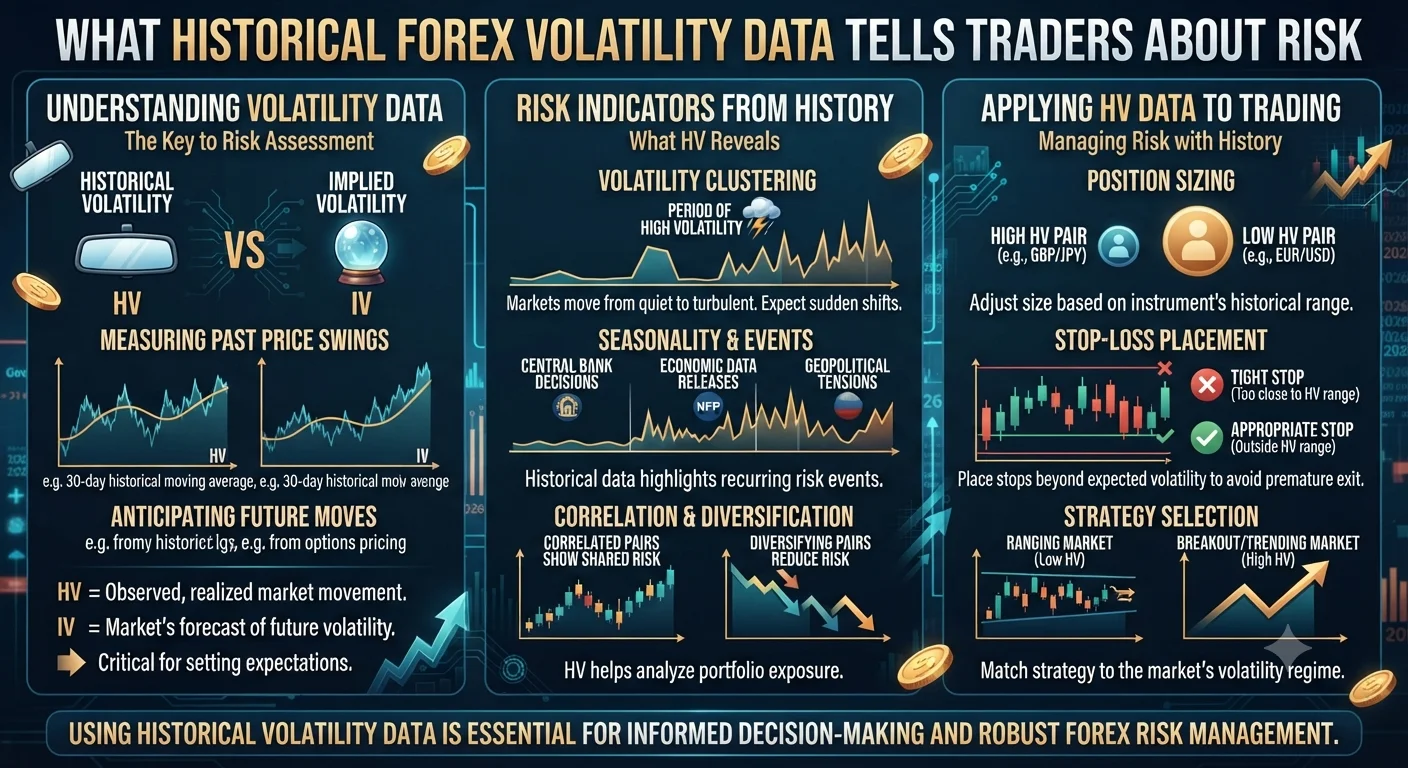
Historical forex volatility data is a record of how much a currency pair actually moved over past periods. Analysing this data reveals the realistic range of outcomes a trader should expect from any strategy, exposes the gap between theoretical backtesting results and live trading reality and provides the foundation for setting stop-losses and profit targets that fit actual market behaviour rather than ideal conditions.
Quick Answer: The Market Impact of Historical Volatility Data
Traders who study historical volatility data before trading live make fundamentally better decisions about stop-loss placement, position sizing and expected drawdown than those who trade without it. The data does not tell you which direction the market will move. It tells you how violently it tends to move and how often conditions shift between calm and extreme. That distinction prevents a category of avoidable losses.
What Historical Volatility Data Actually Shows
- Quick Answer: The Market Impact of Historical Volatility Data
- What Historical Volatility Data Actually Shows
- What the Data Reveals: Five Key Insights
- 1. Normal Daily Ranges Are Wider Than Most Beginners Assume
- 2. Volatility Clusters: Calm Periods Are Followed by Explosive Ones
- 3. Extreme Moves Happen More Often Than Normal Distribution Predicts
- 4. Volatility Differs Significantly by Session and Day of Week
- 5. Volatility Around News Events Creates Distinct Risk Spikes
- How to Access Historical Volatility Data
- Frequently Asked Questions
- Q: How does historical volatility data help with stop-loss placement?
- Q: What are fat tails in forex volatility data?
- Q: Can historical volatility data be used to predict future volatility?
- Q: What is the difference between historical and implied volatility?
Historical volatility is typically expressed as:
Average True Range (ATR): The average pip range per candle over a set period. This is the most practically useful measure for retail traders.
Standard deviation of returns: How widely price returns spread around their average over a defined period. This is used in statistical strategy evaluation and Sharpe ratio calculations.
Annualised volatility percentage: A percentage expressing how much a pair's price moves over a year expressed as an annualised standard deviation. This is used in options pricing and institutional risk modelling.
For most retail forex traders the ATR is the most actionable form of historical volatility data because it translates directly into pip values usable for stop-loss placement and trade planning.
What the Data Reveals: Five Key Insights
1. Normal Daily Ranges Are Wider Than Most Beginners Assume
A common beginner mistake is setting stop-losses that are far too tight because they underestimate how much a currency pair moves in a typical day. Historical ATR data corrects this immediately.
Looking at historical daily ATR data for major pairs reveals typical ranges that surprise many new traders:
| Currency Pair | Historical Average Daily Range |
|---|---|
| EUR/USD | 70 to 100 pips |
| GBP/USD | 90 to 130 pips |
| USD/JPY | 60 to 90 pips |
| GBP/JPY | 120 to 180 pips |
| AUD/USD | 60 to 85 pips |
A trader who sets a 20-pip stop-loss on GBP/USD without consulting this data is placing a stop within the normal daily noise range of the pair. It will be hit repeatedly by random intraday movement before the strategy has any chance to work.
2. Volatility Clusters: Calm Periods Are Followed by Explosive Ones
One of the most well-documented patterns in historical volatility data across all financial markets is that volatility clusters. Periods of low volatility tend to be followed by periods of high volatility and periods of high volatility tend to be followed by calmer conditions.
For forex traders this has two practical implications:
When a currency pair has been trading in a very tight range for several days or weeks the historical data suggests an expansion of volatility is likely approaching. Breakout traders watch for this condition deliberately.
When a pair has recently experienced extreme volatility such as during a major central bank announcement the data suggests conditions will likely calm before the next extreme move.
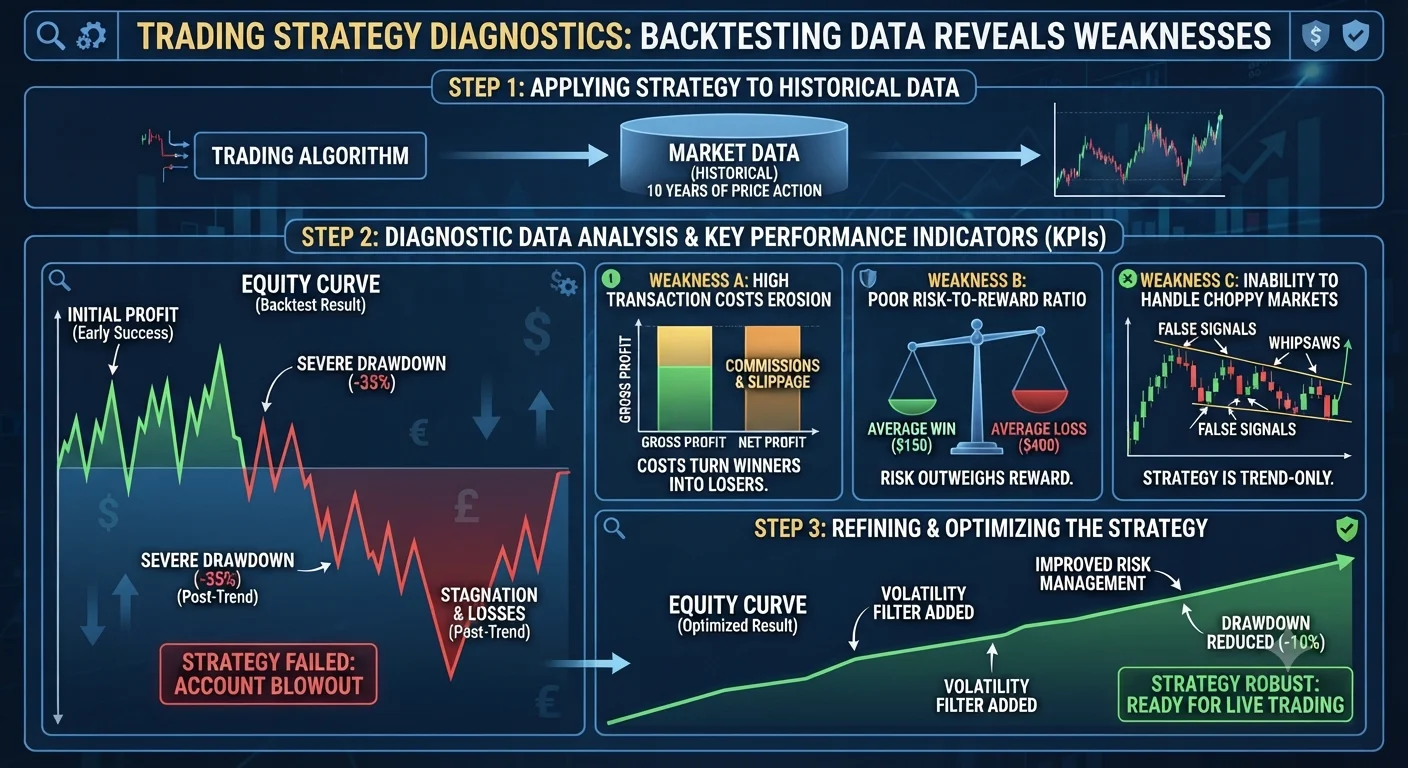
A strategy that performs well in low-volatility conditions may perform very differently in high-volatility conditions. Backtesting across different volatility regimes using historical data reveals this sensitivity before real money is at risk.
3. Extreme Moves Happen More Often Than Normal Distribution Predicts
Standard statistical models assume price returns follow a normal distribution (the classic bell curve). Historical forex volatility data consistently shows that extreme price moves occur far more frequently than a normal distribution would predict. This phenomenon is known as fat tails in the return distribution.
Recommended Articles
 BACKTESTING TRADING INSIGHTS
What this means practically:
A stop-loss set at 3 standard deviations from entry should theoretically be hit only 0.3% of the time according to normal distribution mathematics. In actual forex markets extreme events occur with far greater frequency. Historical data from 2015 (Swiss Franc shock), 2016 (Brexit vote) and 2020 (Covid market crash) all demonstrate moves that were statistically near-impossible under normal distribution assumptions but happened in reality.
This is why experienced traders always maintain stop-loss orders even when they believe a trade is highly unlikely to reverse sharply. The historical data shows that the highly unlikely happens with uncomfortable regularity in currency markets.
4. Volatility Differs Significantly by Session and Day of Week
Historical intraday volatility data shows consistent patterns across sessions and days of the week:
| Period | Relative Volatility |
|---|---|
| Sunday evening open | Very low and often gappy |
| London session open (8 AM GMT) | Sharp increase |
| London-New York overlap (1 PM to 5 PM GMT) | Highest of the day |
| After New York close (10 PM GMT) | Falls significantly |
| Friday afternoon (New York session) | Often lower as traders close weekly positions |
Backtesting a strategy across this historical intraday data often reveals that performance varies significantly by session. A strategy may have a positive expected value during London hours but a negative expected value during the Asian session. Filtering trades to the appropriate session improves overall performance.
5. Volatility Around News Events Creates Distinct Risk Spikes
Historical volatility data around scheduled economic events shows clearly measurable spikes. The ATR in the hour before and after major data releases such as NFP, CPI or central bank decisions is typically two to five times higher than the ATR during normal market conditions.
A strategy that performs well in normal conditions may generate poor results if it holds positions through these spikes. Historical data reveals which events have historically produced the largest volatility expansions so traders can decide whether to avoid those windows entirely.
How to Access Historical Volatility Data
MetaTrader 4 and 5: The built-in ATR indicator provides historical volatility readings directly on the chart. Extend the indicator lookback period to view longer-term volatility history.
Myfxbook volatility tool: A free online tool showing average daily pip ranges for major currency pairs broken down by day of week and time of day based on historical data.
Investing.com and Forex Factory: Both provide historical data downloads for major pairs that can be analysed in spreadsheet software.
Dukascopy historical data: Free high-quality tick data available for download covering many years of history across major pairs for use in detailed backtesting analysis.
Frequently Asked Questions
Q: How does historical volatility data help with stop-loss placement?
Historical ATR data shows the average pip range a pair moves per candle over a chosen period. A stop-loss placed within this average range will be hit by normal price noise rather than by genuine market reversals. Placing the stop-loss at 1 to 1.5 times the ATR beyond the entry gives the trade enough room to withstand typical fluctuations while still defining risk clearly.
Q: What are fat tails in forex volatility data?
Fat tails refer to the higher-than-expected frequency of extreme price moves in actual forex historical data compared to what standard statistical models predict. Essentially the probability of a very large sudden price move is greater in real markets than in theoretical models. This is why stop-loss orders and proper position sizing remain essential even for trades that seem extremely unlikely to go wrong.
Q: Can historical volatility data be used to predict future volatility?
Not precisely. Historical volatility describes what happened in the past and provides a probabilistic context for what is likely but not certain in the future. Markets change and future conditions may differ from historical patterns. However historical data remains the best available starting point for calibrating stop-loss distances, position sizes and strategy expectations because it is grounded in actual market behaviour rather than theoretical assumptions.
Q: What is the difference between historical and implied volatility?
Historical volatility measures how much a currency pair actually moved over a past period. Implied volatility is derived from the pricing of currency options and reflects what the options market collectively expects volatility to be over the future period the option covers. Implied volatility is a forward-looking market estimate while historical volatility is a backward-looking measurement of actual movement.