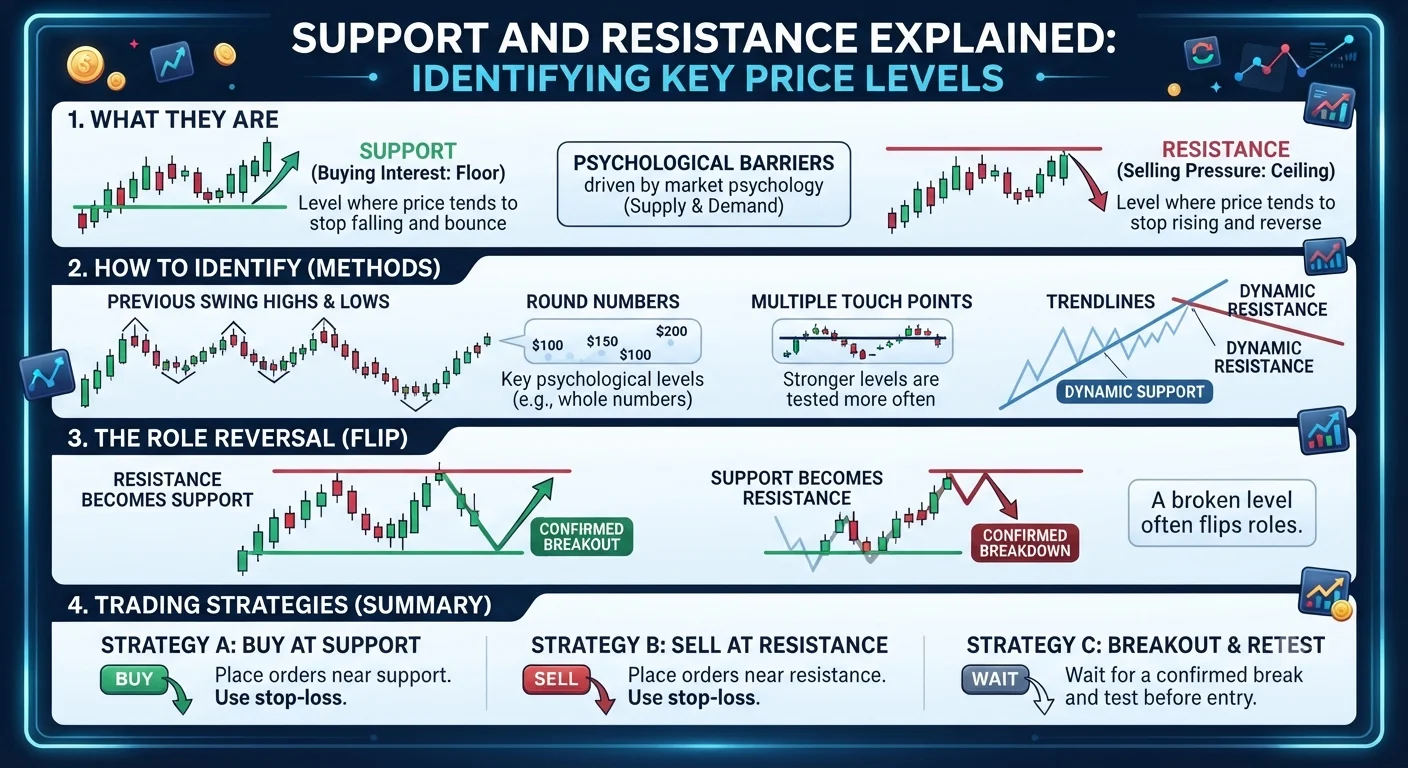
Support is a price level where buying pressure has historically been strong enough to stop the price falling further. Resistance is a price level where selling pressure has historically been strong enough to stop the price rising further. These two concepts are the foundation of technical analysis in forex trading and understanding them correctly gives traders a structured framework for timing entries, placing stop-losses and setting profit targets.
What Support and Resistance Mean in Practice
Think of the price chart as a room with a floor and a ceiling.
The floor is support. Each time the price falls toward it buyers step in, creating enough demand to push the price back up. The floor holds.
The ceiling is resistance. Each time the price rises toward it sellers step in, creating enough supply to push the price back down. The ceiling holds.
Support and resistance levels form because traders remember. When a price level caused a sharp reversal in the past many traders expect it to cause a reversal again when the price returns there. Their collective anticipation and action often makes the level significant a second and third time.
This is one of the most self-reinforcing patterns in all of technical analysis.
Step-by-Step: How to Identify Support and Resistance Levels
- What Support and Resistance Mean in Practice
- Step-by-Step: How to Identify Support and Resistance Levels
- Step 1: Use the Right Time Frame
- Step 2: Look for Previous Highs and Lows
- Step 3: Look for Areas of Consolidation
- Step 4: Note Where Multiple Touches Occurred
- Step 5: Use Round Numbers as Reference Points
- How Traders Use Support and Resistance in Practice
- Buying at Support
- Selling at Resistance
- Role Reversal: When Support Becomes Resistance
- Strong vs Weak Support and Resistance Levels
- Common Mistakes to Avoid
- Frequently Asked Questions
- Q: What is the difference between support and resistance?
- Q: How many support and resistance levels should I mark on my chart?
- Q: Why do previous highs and lows become important levels?
- Q: What does it mean when a support level breaks?
- Q: Can support and resistance be used with other indicators?
Step 1: Use the Right Time Frame
Start your analysis on a higher time frame before moving to a lower one. Daily and 4-hour charts reveal the most significant and widely watched support and resistance levels. Levels visible on the daily chart carry far more weight than those visible only on a 5-minute chart because more participants are watching them.
Recommended approach:
- Identify major levels on the daily chart
- Confirm and refine them on the 4-hour chart
- Use the 1-hour or 15-minute chart to time your actual entry
Step 2: Look for Previous Highs and Lows
The clearest support and resistance levels are formed at previous significant highs and lows on the chart.
Previous lows become support: If the price fell to 1.2650 and then bounced upward that level is now a support zone. If the price returns to 1.2650 buyers who remember the previous bounce are likely to step in again.
Previous highs become resistance: If the price rose to 1.2850 and then fell back that level is now a resistance zone. Sellers who previously sold at that level will likely sell again when the price returns.
Step 3: Look for Areas of Consolidation
Horizontal zones where the price traded sideways for an extended period often become significant support or resistance later. During consolidation many traders placed orders at those levels. When the price breaks out and later returns to the consolidation zone those levels come back into play.
Step 4: Note Where Multiple Touches Occurred
A level becomes more significant the more times the price has tested and respected it. A level touched once is interesting. A level that held on three or four separate occasions across different weeks or months is a genuinely important price zone that many market participants are watching.
Step 5: Use Round Numbers as Reference Points
Whole numbers and round figures (1.2000, 1.2500, 1.3000 on EUR/USD for example) act as natural support and resistance levels in forex. This happens because many traders place orders at round numbers and institutions use them as reference points. Always note when a key technical level coincides with a round number as this adds additional weight to that zone.
How Traders Use Support and Resistance in Practice
Buying at Support
When the price falls toward a known support level a trader following a trend-following strategy looks for evidence that buyers are stepping in before placing a buy trade. This might include a bullish candlestick pattern forming at the support level such as a hammer or bullish engulfing candle, the RSI approaching oversold territory near the level, or the level coinciding with a moving average or Fibonacci retracement.
Recommended Articles
 TRADING STRATEGIES TECHNICAL ANALYSIS
 TRADING STRATEGIES TECHNICAL ANALYSIS
The stop-loss is placed below the support level. If the level breaks and the price closes below it the trade idea is wrong and the loss is contained.
Selling at Resistance
The same logic applies in reverse. When the price rises toward a known resistance level a trader looks for evidence of sellers stepping in before placing a sell trade. The stop-loss is placed above the resistance level.
Role Reversal: When Support Becomes Resistance
One of the most useful patterns in technical analysis is role reversal. When the price breaks below a support level that level often transforms into resistance on the way back up. The buyers who previously defended that level have now been stopped out and become sellers when the price returns.
Similarly when the price breaks above a resistance level that level often transforms into support on pullbacks. This role reversal concept gives traders a logical basis for entry points after breakouts.
Strong vs Weak Support and Resistance Levels
| Characteristic | Strong Level | Weak Level |
|---|---|---|
| Number of previous touches | 3 or more | Only 1 |
| Time frame it appears on | Daily or weekly chart | Only on 15-minute chart |
| Coincides with round number | Yes | No |
| Held across different market conditions | Yes | Only in one condition |
| Volume spike at previous touch | Yes | No clear pattern |
The more strong characteristics a level has the more weight it carries and the more reliable it is likely to be as a future turning point.
Common Mistakes to Avoid
Drawing too many levels: Some traders mark every minor swing high and low until the chart is covered in horizontal lines. This creates noise not clarity. Focus on the three to five most significant levels visible on the daily or 4-hour chart.
Treating levels as exact lines rather than zones: Price does not always turn at exactly the same level it turned at before. Think of support and resistance as zones of approximately 10 to 20 pips wide rather than single precise price points.
Ignoring what happens when a level breaks: A broken support or resistance level does not disappear. It transforms into the opposite level through role reversal. Always update your chart when significant levels are broken rather than continuing to treat them as support when they have become resistance.
Trading against the major trend: A support level in a strong downtrend has a much lower probability of holding than a support level in an uptrend. Always consider the broader trend direction when evaluating how much weight to give a level.
Frequently Asked Questions
Q: What is the difference between support and resistance?
Support is a price level below the current price where buying interest has historically been strong enough to prevent further decline. Resistance is a price level above the current price where selling interest has historically been strong enough to prevent further rise. Together they define the boundaries within which price tends to move and they provide the most fundamental framework for technical trade planning.
Q: How many support and resistance levels should I mark on my chart?
Focus on the three to five most significant levels visible on your primary analysis time frame. More than five starts to create confusion rather than clarity. Prioritise levels that have been tested multiple times and are visible on higher time frames such as the daily chart.
Q: Why do previous highs and lows become important levels?
Previous highs and lows are significant because they represent price points where supply or demand was strong enough to reverse the trend at that moment. Many traders remember these levels and place orders around them when the price returns. This collective memory and action reinforces the significance of the level.
Q: What does it mean when a support level breaks?
When the price closes convincingly below a support level it means buyers were not strong enough to defend that zone. The broken support often becomes resistance on any subsequent rally. This role reversal is one of the most practically useful patterns in technical analysis and often provides low-risk entry points for continuation trades in the direction of the break.
Q: Can support and resistance be used with other indicators?
Yes and using them together with indicators significantly improves trade quality. The most effective combinations include using RSI to confirm oversold conditions at support or overbought conditions at resistance, using moving averages as dynamic support and resistance levels, and using Fibonacci retracement levels to find where a pullback within a trend is likely to find support.