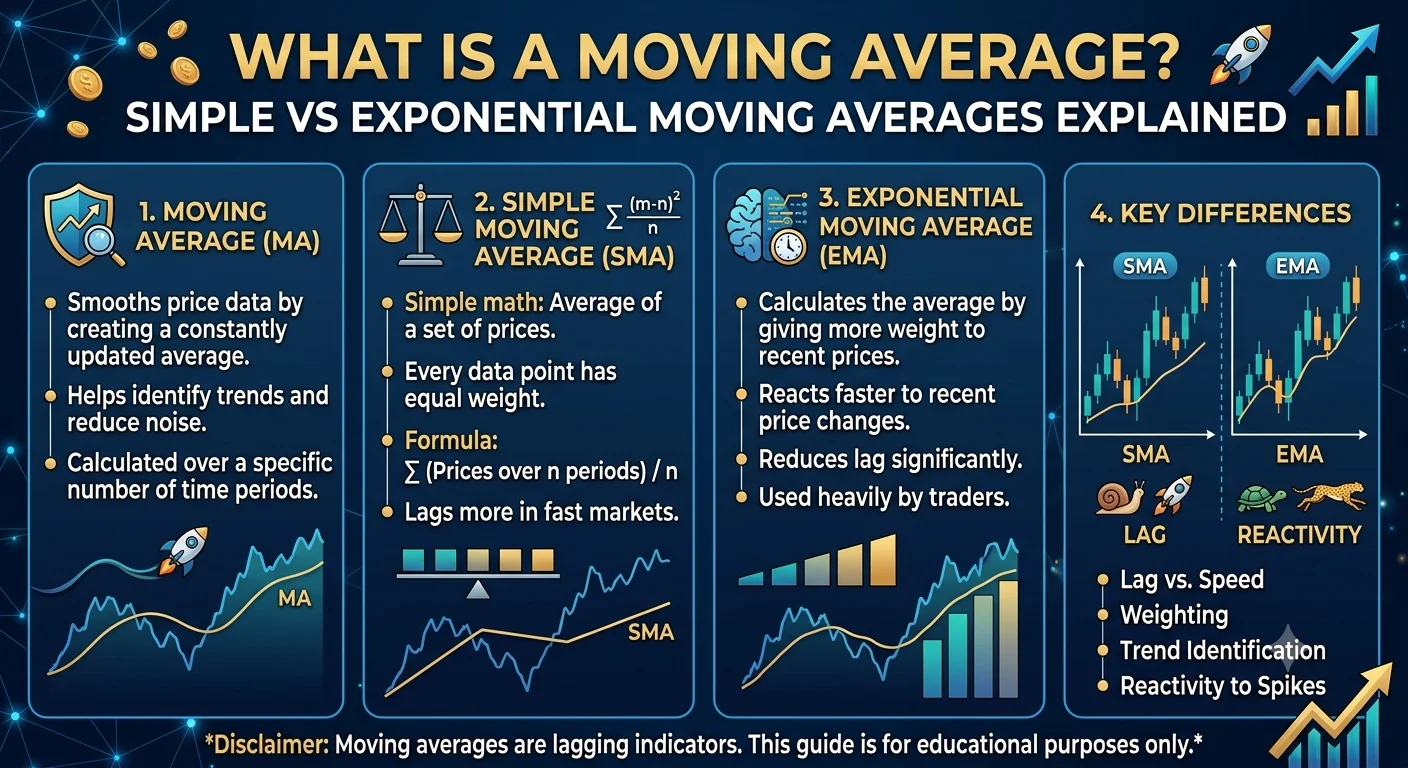
A moving average is a technical indicator that calculates the average price of a currency pair over a set number of past periods and plots that average as a continuous line on the price chart. As new price data arrives the average updates and moves forward, smoothing out short-term price fluctuations to reveal the underlying trend direction more clearly. It is one of the most widely used indicators in all of forex technical analysis.
Quick Answer: The Key Difference at a Glance
There are two primary types of moving average used in forex trading:
The Simple Moving Average (SMA) gives equal weight to every price in the calculation period. A 20-period SMA adds up the last 20 closing prices and divides by 20.
The Exponential Moving Average (EMA) gives greater weight to the most recent prices in the calculation period. This makes it respond more quickly to recent price changes than a simple moving average of the same period length.
In practical terms the EMA reacts faster to new price developments. The SMA is smoother and less reactive. Both serve the same core function of identifying trend direction and providing dynamic support and resistance levels.
Understanding Simple Moving Averages (SMA)
- Quick Answer: The Key Difference at a Glance
- Understanding Simple Moving Averages (SMA)
- How the SMA Is Calculated
- Common SMA Periods and Their Uses
- Understanding Exponential Moving Averages (EMA)
- How the EMA Differs
- Side-by-Side Comparison: SMA vs EMA
- How Traders Use Moving Averages in Practice
- Trend Identification
- Dynamic Support and Resistance
- Moving Average Crossover Systems
- Common Mistakes to Avoid
- Frequently Asked Questions
- Q: Which moving average period is best for forex trading?
- Q: Should I use SMA or EMA for forex trading?
- Q: What is the golden cross in forex?
- Q: Can moving averages be used in an automated trading system?
How the SMA Is Calculated
The SMA is the straightforward arithmetic average of the closing prices over a selected number of periods.
Example using a 5-period SMA:
| Period | Closing Price |
|---|---|
| 1 | 1.0820 |
| 2 | 1.0840 |
| 3 | 1.0860 |
| 4 | 1.0850 |
| 5 | 1.0870 |
SMA = (1.0820 + 1.0840 + 1.0860 + 1.0850 + 1.0870) divided by 5 = 1.0848
As period 6 arrives, period 1 drops out and the new average is calculated. The line on the chart moves forward with the price data.
Common SMA Periods and Their Uses
Different period lengths serve different analytical purposes:
| SMA Period | Common Name | Primary Use |
|---|---|---|
| 10 to 20 | Short-term SMA | Identify short-term trend and momentum |
| 50 | Medium-term SMA | Key dynamic support and resistance level |
| 100 | Long-term SMA | Broader trend direction indicator |
| 200 | Long-term SMA | Major institutional reference level, primary trend filter |
The 200-period SMA on the daily chart is one of the most closely watched levels in the entire forex market. Many institutional traders use the 200-day SMA as a primary trend filter, with prices above the 200 SMA considered broadly bullish and prices below it broadly bearish.
Understanding Exponential Moving Averages (EMA)
How the EMA Differs
The EMA uses a weighting multiplier that gives exponentially more importance to recent closing prices. The exact calculation is more complex than the SMA but the practical result is a line that reacts more quickly to recent price changes.
Visual comparison on the same chart:
On a EUR/USD 4-hour chart with both a 50-period SMA and a 50-period EMA plotted:
- When EUR/USD is falling sharply the 50 EMA will already be sloping downward more steeply than the 50 SMA because recent falling prices carry more weight
- When EUR/USD reverses upward the 50 EMA will begin rising sooner than the 50 SMA because the recent upward prices are weighted more heavily
This responsiveness makes the EMA more suitable for active traders who want earlier signals. The tradeoff is more frequent false signals in choppy, ranging market conditions.
Side-by-Side Comparison: SMA vs EMA
| Factor | Simple Moving Average (SMA) | Exponential Moving Average (EMA) |
|---|---|---|
| Calculation | Equal weight to all periods | More weight to recent prices |
| Responsiveness | Slower to react | Faster to react |
| Smoothness | Smoother line, less noise | More reactive, more noise in ranges |
| False signals | Fewer in ranging markets | More in ranging markets |
| Early trend signals | Later entry | Earlier entry |
| Best used for | Identifying major trend direction | Active trend trading and crossover systems |
How Traders Use Moving Averages in Practice
Trend Identification
The most fundamental use of a moving average is trend identification. The direction of the moving average line and the position of the price relative to it gives traders an immediate picture of trend direction:
Recommended Articles
 TRADING STRATEGIES TECHNICAL ANALYSIS
 TRADING STRATEGIES TECHNICAL ANALYSIS
- Price consistently above the moving average and the MA sloping upward: uptrend
- Price consistently below the moving average and the MA sloping downward: downtrend
- Price crossing back and forth above and below the MA repeatedly: ranging, no clear trend
Dynamic Support and Resistance
Moving averages act as dynamic support and resistance levels because many traders watch the same commonly used periods. When EUR/USD pulls back to the 50 EMA on the daily chart during an uptrend buyers who use the 50 EMA as a reference level step in, which reinforces the level as support.
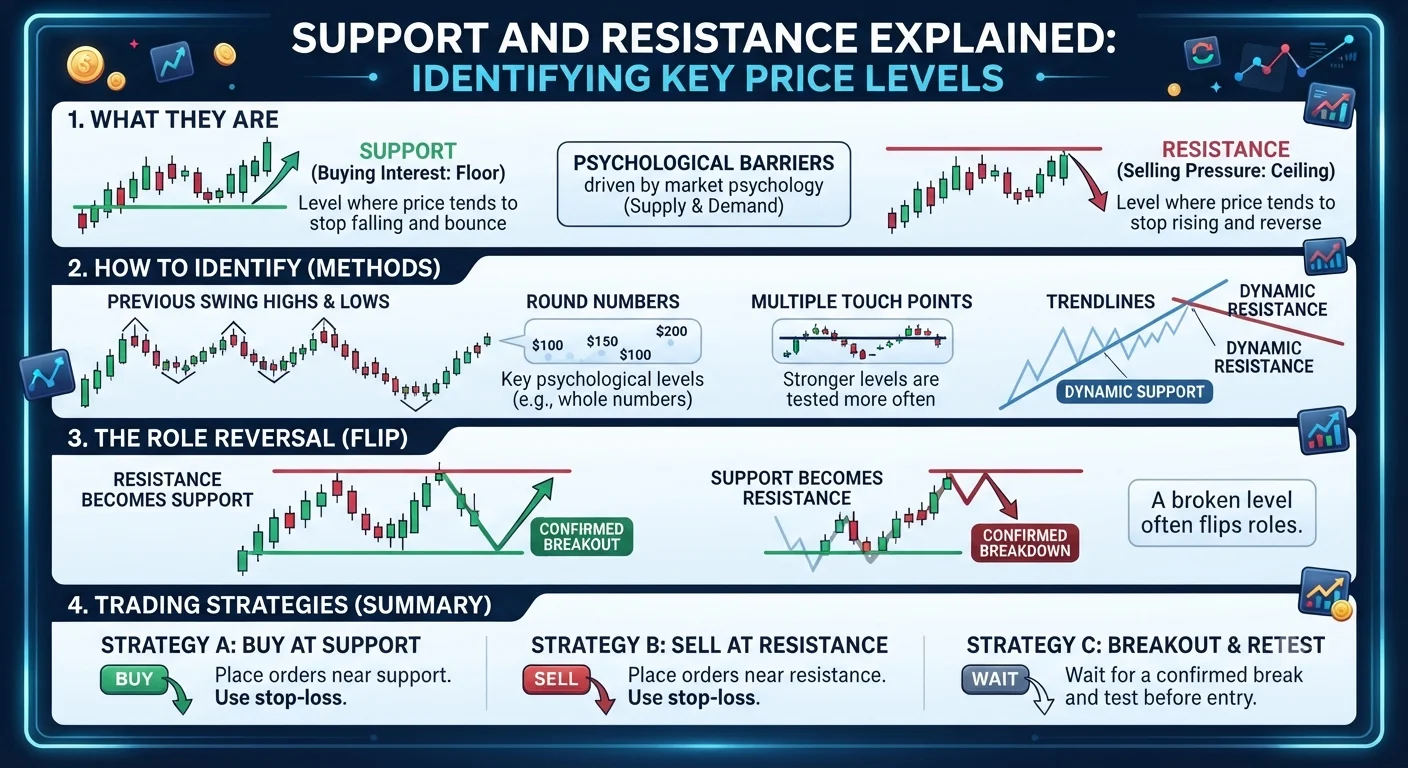
- Support and Resistance Explained: How to Identify Key Price Levels
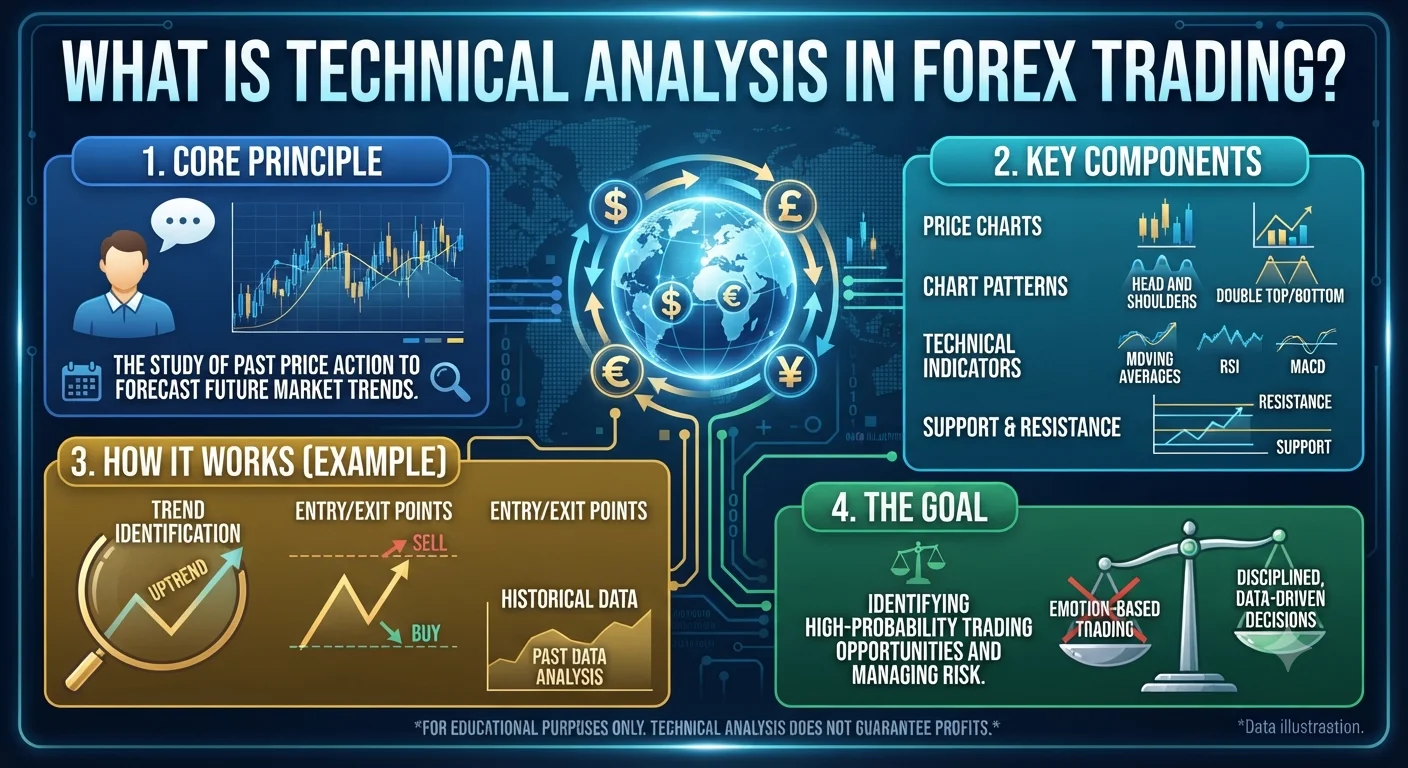
- What Is Technical Analysis in Forex Trading?
Moving Average Crossover Systems
One of the most widely backtested setups in all of technical analysis is the moving average crossover. Two moving averages of different periods are plotted on the same chart. A trade signal is generated when the faster (shorter period) moving average crosses above or below the slower (longer period) moving average.
The Golden Cross and Death Cross:
Golden Cross: The 50-period MA crosses above the 200-period MA. This is considered a bullish signal suggesting the medium-term trend has turned upward relative to the long-term trend.
Death Cross: The 50-period MA crosses below the 200-period MA. This is considered a bearish signal suggesting the medium-term trend has turned downward relative to the long-term trend.
These crossovers are widely reported in financial media and watched by a large number of market participants which adds to their significance as reference points even for traders who do not use moving averages as primary signals.
Common Mistakes to Avoid
Using moving averages in isolation in ranging markets: Moving averages are trend-following tools. In a sideways ranging market they generate repeated false crossover signals in both directions. Always confirm the broader market context before relying on moving average signals.
Optimising the period to fit past data: Some traders adjust moving average periods until they find settings that would have produced perfect buy and sell signals on historical data. This is a form of over-optimisation. The strategy will likely fail when applied to new data. Use commonly referenced periods such as 20, 50, 100 and 200 which are widely watched and carry genuine market significance.
Treating a single MA cross as a complete strategy: A moving average crossover is a signal not a complete trading system. It needs to be combined with a clear stop-loss rule, a position sizing approach and an exit strategy to function as a proper trading system.
Frequently Asked Questions
Q: Which moving average period is best for forex trading?
There is no single best period. The most widely used periods in forex are 20, 50, 100 and 200. The 50 EMA and 200 EMA on the daily chart are among the most closely watched levels by institutional and retail traders alike. The right period depends on your trading style: shorter periods suit shorter-term strategies and longer periods suit swing and position trading.
Q: Should I use SMA or EMA for forex trading?
Both are widely used and both have merit. The EMA reacts faster and provides earlier signals which suits active day traders. The SMA is smoother and better at filtering out short-term noise which suits swing traders and position traders looking for major trend direction. Many experienced traders use both simultaneously to gain different perspectives on the same market.
Q: What is the golden cross in forex?
A golden cross occurs when a shorter-period moving average, most commonly the 50-period MA, crosses above a longer-period moving average, most commonly the 200-period MA. It is widely interpreted as a medium to long-term bullish signal. The opposite pattern where the 50 MA crosses below the 200 MA is called a death cross and is interpreted as bearish.
Q: Can moving averages be used in an automated trading system?
Yes. Moving average crossovers are among the most commonly used entry signals in automated forex trading systems and Expert Advisors because they translate naturally into simple, clearly definable programmatic rules. The crossover condition can be precisely coded and tested on historical data through backtesting.