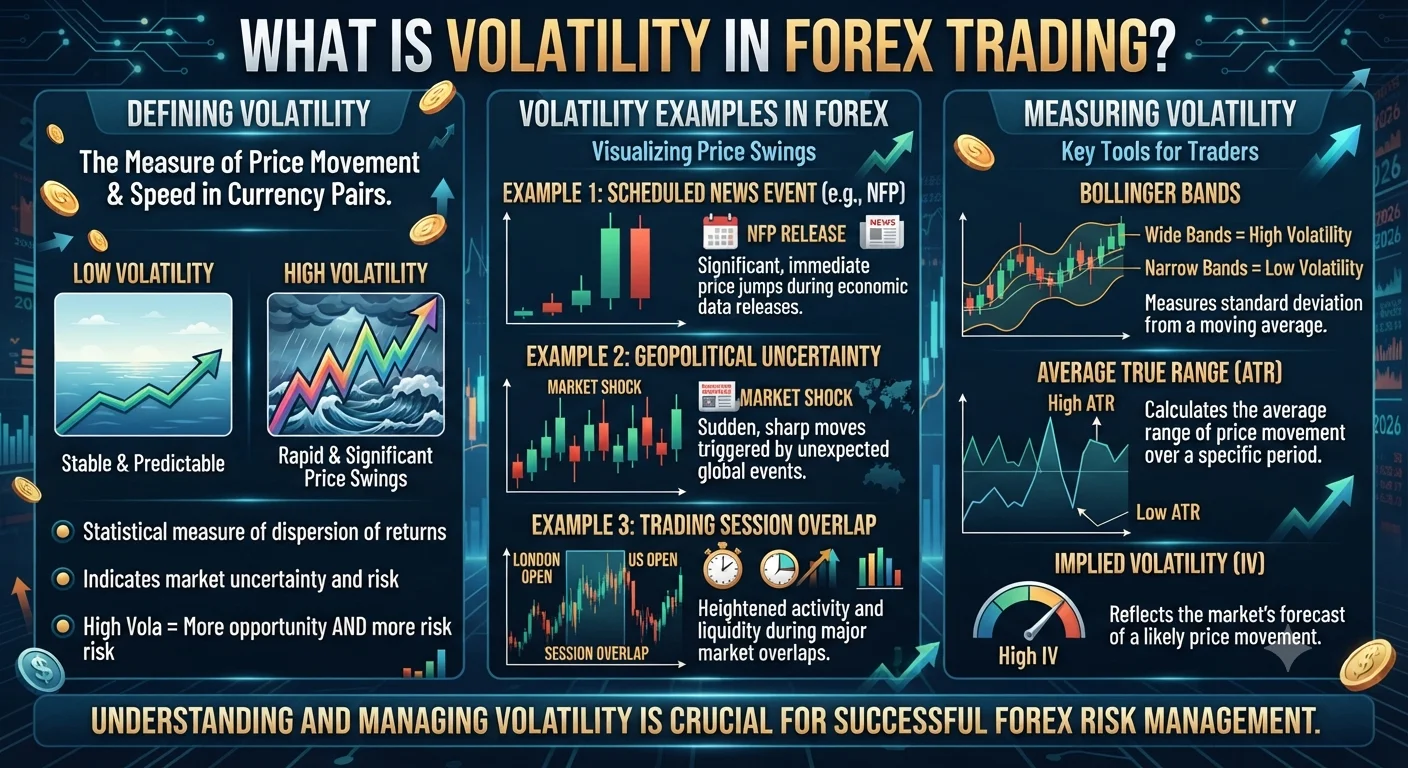
Volatility in forex trading is a measure of how much a currency pair's price moves over a given period of time. A highly volatile pair moves a large number of pips in a short time. A low-volatility pair moves slowly and within a narrow range. Volatility is neither good nor bad on its own. What matters is whether a trader's strategy, position sizing and stop-loss placement account for the volatility of the pair they are trading.
Quick Definition: What Is Volatility?
When traders talk about a volatile currency pair they mean a pair whose price changes rapidly and by large amounts relative to its typical range. When they talk about a low-volatility pair they mean one that moves slowly and predictably within a narrow range.
Volatility is measured statistically as the standard deviation of price returns over a period of time. A higher standard deviation means prices are spreading out more widely from their average. A lower standard deviation means prices are staying closer to their average.
In practical trading terms volatility is most often discussed in two forms:
Historical volatility (HV) also called realised volatility measures how much a currency pair actually moved over a past period. It tells you what the pair did.
Implied volatility (IV) is derived from the pricing of currency options and reflects what the market expects volatility to be in the future. It tells you what the market thinks the pair will do.
Most retail forex traders work primarily with historical volatility data accessed through tools like the Average True Range (ATR) indicator.
How Volatility Works in Real Forex Trading
- Quick Definition: What Is Volatility?
- How Volatility Works in Real Forex Trading
- The Average True Range (ATR)
- Which Currency Pairs Are Most and Least Volatile?
- How Volatility Changes Over Time
- A Practical Example
- Why Volatility Matters for Your Trading Results
- Frequently Asked Questions
- Q: Is high volatility good or bad in forex trading?
- Q: What causes volatility to spike in forex markets?
- Q: What is the Average True Range (ATR) indicator?
- Q: Do exotic currency pairs always have higher volatility than major pairs?
The Average True Range (ATR)
The most practical volatility tool for retail forex traders is the Average True Range (ATR) indicator, developed by technical analyst J. Welles Wilder. The ATR measures the average range of price movement per candle over a selected number of periods.
How to read ATR:
If the 14-period ATR on the EUR/USD daily chart reads 80 pips it means the pair has been moving an average of 80 pips per day over the past 14 trading days. This gives traders a concrete reference point for:
- Setting realistic take-profit targets (a target of 200 pips on a pair that moves 80 pips per day on average may require several days to reach)
- Placing stop-losses beyond the noise of normal daily movement (a stop-loss of 20 pips on a pair with an 80-pip ATR may be hit by random intraday movement before the trade direction plays out)
- Comparing volatility across different pairs when choosing which to trade
Which Currency Pairs Are Most and Least Volatile?
Volatility varies significantly across currency pairs. As a general rule major pairs involving the US Dollar are less volatile than minor pairs and significantly less volatile than exotic pairs.
| Volatility Level | Examples | Typical Daily Range |
|---|---|---|
| Low | EUR/USD, USD/CHF | 50 to 90 pips |
| Moderate | GBP/USD, USD/CAD | 80 to 120 pips |
| Higher | GBP/JPY, EUR/AUD | 100 to 180 pips |
| High | USD/TRY, USD/ZAR | 200 to 500 pips or more |
These ranges are illustrative approximations. Actual volatility changes constantly with market conditions. Always check current ATR readings rather than assuming fixed ranges.
How Volatility Changes Over Time
Volatility is not constant. It contracts and expands in cycles:
Volatility contraction happens during quiet market periods, public holidays, or between major news events when few participants are active. Price moves in a tight range.
Volatility expansion happens around major economic data releases, central bank decisions, geopolitical events and market open periods. Price moves rapidly and by large amounts.
Recommended Articles
 FOREX GLOSSARY TERMINOLOGY
The London and New York session overlap (1 PM to 5 PM GMT) typically produces the highest intraday volatility across major pairs. Sunday evenings and the quiet period between the New York close and the Tokyo open typically produce the lowest volatility.
A Practical Example
A trader wants to buy GBP/USD and plans to place a stop-loss 30 pips below their entry. They check the 14-period ATR on the 4-hour chart and see it reads 55 pips.
This tells them that GBP/USD has been moving 55 pips per 4-hour candle on average. A stop-loss of 30 pips is smaller than the pair's average movement per candle. It is very likely to be hit by normal price noise before the trade has time to develop in the intended direction.
A more appropriate stop-loss might be 60 to 80 pips, placed beyond the ATR range to give the trade room to breathe. The trader then adjusts their position size using their position sizing calculator to ensure this wider stop still keeps their risk at 1% of account.
This is how volatility data directly shapes both trade structure and position sizing in practice.
Why Volatility Matters for Your Trading Results
Stop-loss placement: Stop-losses set too tight relative to the pair's volatility will be hit repeatedly by normal price noise rather than by genuine market reversals. ATR-based stop-loss placement avoids this.
Profit target realism: Take-profit targets set at multiples of the ATR are achievable within a realistic time frame. Targets set at 10 times the ATR on a low-volatility pair may require weeks to reach if they are ever reached at all.
Strategy selection: Scalping strategies that rely on small pip moves work best on high-volatility pairs during active sessions. Range-trading strategies work best during low-volatility consolidation periods.
Risk adjustment across pairs: A position sized correctly for EUR/USD (low volatility) will be far too large and carry far too much risk if applied unchanged to GBP/JPY (high volatility). Always recalculate position size when switching between pairs with different volatility profiles.
Frequently Asked Questions
Q: Is high volatility good or bad in forex trading?
Neither. High volatility means larger pip movements which creates more profit potential but also more risk. Low volatility means smaller movements which limits both profit potential and loss size per trade. The key is matching your strategy and position sizing to the volatility level of the pair you are trading rather than seeking the highest or lowest volatility as an end in itself.
Q: What causes volatility to spike in forex markets?
The most common causes of volatility spikes include major central bank decisions and press conferences, high-impact economic data releases such as NFP, CPI and GDP reports, unexpected geopolitical events, natural disasters, political elections and sudden shifts in global risk sentiment. Traders use the economic calendar to anticipate periods of likely higher volatility.
Q: What is the Average True Range (ATR) indicator?
The Average True Range is a technical indicator that calculates the average price range per candle over a set number of periods typically 14. It does not indicate direction. It measures how much the price is moving. A rising ATR means volatility is increasing. A falling ATR means volatility is contracting. It is the most widely used tool for volatility-aware position sizing and stop-loss placement in retail forex trading.
Q: Do exotic currency pairs always have higher volatility than major pairs?
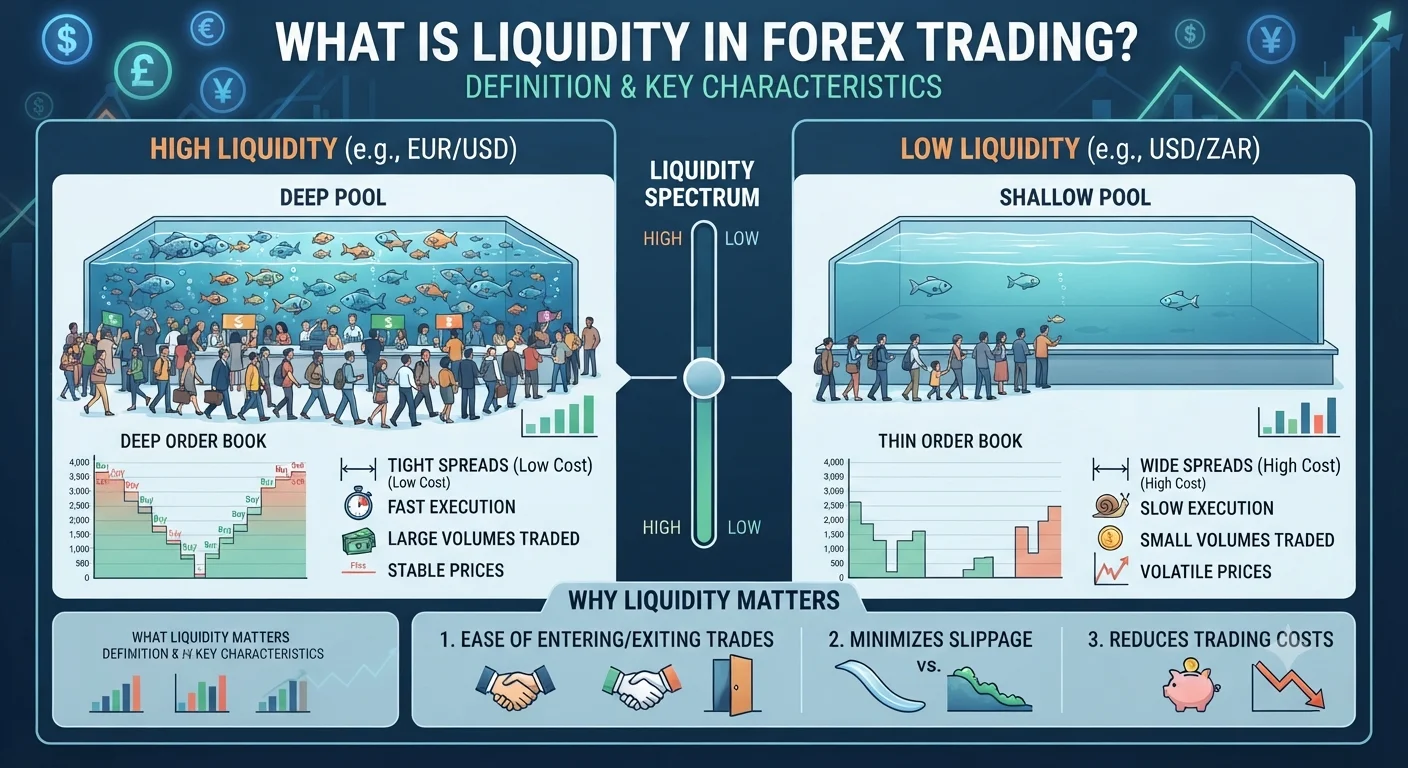
Generally yes. Exotic pairs involve currencies with lower daily trading volume and less global liquidity which makes them more susceptible to large price swings from relatively small order flows. They also tend to have wider spreads which increases the cost of trading them. However even major pairs can experience extreme volatility during major economic surprises or geopolitical events.